Monday, June 2, 2014

Arctic Ocean lake models

~Smaller,  much easier to understand Arctic lakes are great examples of sea ice melting processes


   June 1 Northern Quebec Picture.  Note the lakes which are mostly frozen are the biggest ones, the land lost its snow carpet.  All seems to be normal.  Except here in this single picture we can see all sea ice melting processing in one swift glance.    First the land,  which like Siberia or Northern Canada,
sea ice does not melt first, but rather the snow over land.  But here is the kicker, it is a common misconception to believe that land heat capacity is greatest,  not so,  it is lesser compared to water and ice.   Heat capacity of land is twice as less than ice,  yet the snow is mostly all gone.    For every 2 joules of heat gained by land gives  about 2 C of temperature increase.  While the same 2 joules raises ice temperature by 1 C.  The heat capacity differences of each physical feature explain this picture. But there is more,  the smaller lakes lost their ice first,  as opposed to the bigger ones.  Again land dominates the smaller bodies of water, either by shedding comparatively more snow melt water or their land spread dominance creates greater surface temperatures than at the middle of a big lake;

    A large lake  coincidentally looking like the Arctic Ocean,  has exactly the same melt features as during later summer over the Arctic Ocean.  There are melt ponds.  But these go along with the shorelines broken from their bonds of ice.  The ice appears also shattered and in new packs,  the smaller bits will last not long enough to look like sea ice pancakes.  But the shores melt first not the lake centre,  which has its own micro climate spreading outwards.
    Further to the South, an even bigger lake shows watershed on its surface,  causing different albedo properties.  Even sturdy and massive this ice end is nigh, for now,  the shores are not open, it is massive, its micro climate is so much bigger than the lake looking like the Arctic Ocean,  that its influencing neighbouring region making adjoining smaller lakes  still frozen .  We have here a good example of climates to come,  a much wider open Arctic ocean influences a huge Hemispherical chunk of planet Earth.  If it is all frozen up during summer the planet remains cooler,  but if vast segments of its extent are open water,  the lands next to it warm, and the lands next to the warmed lands warm further.  But ice,  consolidated, thick and white is like a single sunlight reflector.  If lake ice nowhere as thick as sea ice has a local significant impact, sea ice influences weather worldwide.  Ice is like an entity,    part of our climate system.  Once gone so goes cooling.   We know ice does not melt completely unless surrounded by heat,  from bottom, then from sides and finally top.    The weighted temperature of the ice column  must be colder than its surroundings for it to exist.  wd June 2,2014


Friday, May 23, 2014

Finding sea ice underside melting at any time

~ A refraction discovery is dwarfed by its much larger data application.  
~ Observing underside melting will help understand sea ice dynamics.  


 From the fascinating revelation of actually observing whether the underside of sea ice is melting or not.  We can can take it to a  much larger scale,  to the space platforms.   Where the thawing action is visible whenever they display their daily average temperature results. At first glance, it may surprise some,  the underside overall melts in a wide section  one day,  then to another area much further away the next,  leaving the impression of chaos which if you go underwater at the North Pole,  you would see just that,  underside art of mix geometry and light,  art only nature can achieve.

Refraction Discovery …

THIN SEA ICE  horizon

     Going back to several articles on EH2r,  sketches are needed to explain how we can see what is going on under more than hundred of centimeters of ice.   First we must observe what happens during Arctic Ocean late fall,  nascent sea ice sheet grows quite rapidly:


Super accretion
Tw : temperature of top of sea water;   Ti: top of sea ice temperature;   Ta :   air surface temperature.


 In Arctic autumn,  with  new sea ice just formed, thermal fluxes are aligned upwards to space.  Sea ice thickens quickly in direct relation to Ta,  surface Air Temperature,  the colder surface air is, the faster ice accretes .   In late fall , Ta is coldest of the mediums.  Conduction from either sea water and ice  go upwards just alike.   Adiabatic convection affects the cooling process accelerating it much further.  This gives super accretion optically seen by the lowering of the horizon:

Super accretion mirages of the freshly formed sea ice,  the horizon is dramatically low,  because new sea ice is quite warmer than the air just above.   The horizon line should be on top of the grey cloud like layer, right under is the refracted sky by an inferior mirage.


LONG NIGHT ice

     After the start of the long Arctic night,  where sea ice thickness exceeds 50 cm,  thermal flux to space is not as strong when cloud free,  as the ice thickens, absent sun makes top of sea ice largely always colder than surface air,   surface to air adiabatic lapse rates with thin ice turns to stable isothermal layers.  A near permanent thermal inversion  exists.  Up to hundreds of meters above ice in darkness,  the air subsists almost always warmer,  but does nothing but cooling.   The horizon at that time is almost always much higher than fall [unless fall time has a rare huge influx of warm air temperatures].   Surface air temperature colder than top of ice is a super accretion event of late fall, theoretical possible with winter thick ice (by cold air advection).   However,  I have very few observations of the lower horizon during darkness (most are caused by low clouds).   Therefore super accretion with thick sea ice is a very rare or unlikely event.    No atmospheric adiabatic convection along with less long wave radiation escaping to space slows sea ice accretion.  With numerous cumulative days in darkness,  top of sea ice becomes coldest  making a progressively thicker coldest strata from top towards bottom.   Much warmer air can only be found higher above,  from its peak in warmest temperature a stable near continuous inversion is made which has a profound impact in slowing further extreme cooling of sea ice. The equivalent to thick sea ice insolation exists invisibly but not near the horizon:


Near permanent inversion leaves the horizon risen throughout the dark season,  only lowered by low clouds.   Sea ice has a totally different look,  its white instead of dark,  snow also covers most of its surface.   The height of the horizon varies according to the lapse rate ,  a calculation:

    Horizon Height is directly proportional to the difference in temperature between Ta and Ti.   The colder Ti the higher the horizon,  like the example above. 

Moderate accretion happens by the shear thickness of the ice, now a large insulator,  thermal flows upwards towards space are similar to the fall scenario except less heat escapes,  more often than not,  it is the top of the ice which is the coldest medium, the difference in temperature between very near ice air may be small with gradual warming further aloft.  Cooling of air near the ice adds a downward thermal flux, but since air has significantly less heat capacity,  the ice absorbs a fraction of this long wave heat but does not warm up much from the gain and re-emits thermal rays towards space.   Unlike during Autumn,  the thicker colder ice layer causes accretion.

      These sketches are done without the presence of clouds in mind.   Thermal flows dramatically change when low overcast cloud conditions exist, when so,  sea ice horizon height lowers similar to effects by the noon sun.  In addition to a cold on top and warm ice strata below, a thinner top of ice temperature variance zone always susceptible to weather must be common.   But the net effect of the long Arctic night creates a large coldest ice layer which becomes steep in proportion to the severity of winter degree days, accordingly,  spring  season onwards sea ice requires significant warming before the structure of the lower Arctic Ocean atmosphere changes more permanently. 


Return of the sun

       In Early Spring, Ice Thickness depends on how long night climate conditions were.    But more than 100 cm First year ice , as usually measured throughout the Arctic at winter sunrise, has specific thermal properties in relation to depth which changes diurnally.  A coldest temperature layer lurks near top of ice,  but when sunny,  is found deeper above sea ice centre column.  When evening occurs, top of ice cools by short lived adiabatic convection,  the coldest layer just below ice surface accelerates the re-cooling strangely faster than the lower specific heat capacity of air.  Top of ice and subsequently the air right above cools,   this gives the sea ice rising horizon diurnal effect in a cloud free atmosphere:

     Left picture horizon was lowered from solar ray battering,  layers of the near and gradually more distant horizon appear to grow on top of each other until they form an ice wall (center and right).  Ice is warmest after Local Apparent Noon,  coldest in the morning prior to sunrise and for a few hours after.  This rising horizon simply indicated that the top of sea ice was only partially warmed, as the sun lowered,  cooled fast by convection  and contact conduction by the larger much colder ice layer immediately under.  Surface air  cooled less as rapidly,  but only very near top of the ice first,  then upwards in altitude. 


    In the evening after a sun ray bath,  top of ice appears to cool fastest.   From a starting point of surface air and top of sea ice having the same temperature,  the lowest air stratum in direct contact cools along with sea ice,  causing readily visible thermal layering which becomes the famous Norse "ice wall".   This "wall" becomes higher as the inversion becomes steeper at the ice surface to air interface.  The inversion peak also rises in altitude,  this makes "ducting",  a refraction phenomenon similar to fibre optics, possible at higher above the horizon.  Accretion continues in such  a time of day,  but much weaker,  because the ice is thick and was warmed by earlier solar heating,  a bottom refreeze can make this accretion unnoticeable. 


After Local Apparent Noon Melting of sea ice  

Here is where an horizontal observation is linked to satellite data,  after a few hours exposure to sun rays,  the ice horizon lowers until bottoming at the true astronomical horizon:


    About 2 hours after Local Apparent Noon , April 10 2014,  the horizon is at its lowest point.  Top of ice warmed no more,  the horizon stayed fixed,   underside of ice melting has occurred for about an hour.  


   As seen from the refraction largely nullified,  the ice horizon is at the same height as with open sea water in autumn when the temperatures between sea and surface air are the same.   Ti = Ta  means there is very little or no more loss of thermal heat from sea to space,  especially since short wave heat is added to the ice by the sun warming  its top layer.  The coldest ice layer shrinks,  more thermal heat from sea water is focused on the bottom of the ice.  The  underside melts until  very top of sea ice becomes coldest again. The reason for the temperature stalemate is found with the latent heat of melting at bottom.  Excess heat can't increase temperature because excess heat goes to melting ice. 

Applied formulas

   Since sea ice can have 2 distinct surface to air attributes;   very warm air above the freezing point of sea ice does not need much consideration whether the surface to air profile is adiabatic or stable.  Any underside melting formula should be adjusted accordingly .   The summer formula:  


    Ta >= Ti  hypothetical formula for determining where thick sea ice underside melts. Applies when Ta is equal or greater than -1.8 C .

         If the average surface temperature is greater or equal to the average temperature of top of sea ice,  its underside melts because thermal rays no longer escape from sea towards space.  3 meter sea ice bottom also melts for the same reason.  Even melting thicker sea ice just as much.    According to many buoy data,  the bottom of the ice column temperature  is nearly the same to adjoining sea water.   The process of accretion,   which exists when top of sea water thermal rays escape to space,  adds more ice onto the underside,   but when there is no longer any heat escaping,  ice bottom melting should start.   

          When the daily average temperature  of surface air exceeds or equals top of  ice average temperature,  there is an overall net melting of sea ice. Thickness loss is not seen above on the surface aside from the snow which appears to sublimate and becoming more porous.   At any given day with good satellite data,  we can observe where the melting occurs. Apparently it varies with the weather towards the centre of the Arctic Ocean.  Applying the formula to satellite data charts,  we can clearly delineate Arctic Ocean pack adjoining open water where  temperatures  of air and sea ice match,  obviously there is melting along sea ice shores: 


University of Maine excellent daily temperature averages of both sea ice top and surface air can be joined or superimposed to reveal where Ta is greater or equal to Ti:


A confirmation of sorts can be seen,  I traced by hand where Ta is >= Ti in black.  Of Course, Arctic Ocean sea ice shorelines must have underside melting especially at this time of the year.   What is most interesting are the long segments of apparent melting deep towards the North Pole.  These are weather related, as with weather, they are not consistent until  overwhelming heat takes charge of the Arctic:

A few days later and Hudson Bay underside sea ice appeared  completely melting.  But note Central Arctic Ocean melt zones with a totally different look.  This is not surprising.  But a long time chart of underside melting averages may be interesting.  


During early Polar spring days (Ta < -1.8 C), the melting period lasts as long as Ta = Ti. After the long night sunrise, the melting period gradually increases day by longer day by solar rays increasing in power with the sun rising in altitude.  Despite sea ice albedo and or reflection of rays back upwards, there is a significant enough absorption of solar rays to warm up top of sea ice to change thermal flux pattern diurnally. 


At lower surface temperatures than -1.8 C, the formula Ta = Ti maintains an isothermal interface, in such instances top of ice has a net positive or downward thermal flux towards the coldest layer, sea ice underside can melt even during the presence of very cold surface temperatures. (Ti > Ta has not been optically observed with thick ice with clear air ).


     A totally new perspective of analyzing sea ice optically has important features which become even grander when taken to a much larger scale. From all available data to date, the underside of sea ice melts when sea water thermal flux loss towards space becomes cut off by surface heat input either by the sun or by clouds. Low clouds resends lost Long Wave Radiation towards the surface, obviously this heat feedback is not as strong as high sun warming, studying the cloudy horizon has many pitfalls related to low contrast resolution. I suspect low clouds, a feature of warmer Arctic weather may contribute to much slighter bottom melting or certainly a stop of accretion, as long as surface temperatures are equal or higher than top of sea ice, in this case warmer air matters more.  Arctic Ocean  summer season of 2013 had more underside thawing than from the sun, extent and area was muddled by the lack of sea ice compaction by the extensive presence of cloud laden cyclones,   nevertheless a significant minimum was achieved.  

      Hypothetical proof:

      Observation data can prove underside melt despite lack of actual high resolution measurements.    Phase change is key, it takes energy to melt ice,  but when it freezes there is a release of latent heat.  This latent heat of fusion should reverse the cooling of top of sea ice, hence it should be seen lowering the horizon again.  A clear  day on April 24 2014 with the right conditions showed exactly this:

                                               Time        horizon
                                                               elevation   
  LAN                             2.97      
+ 1 hr 1 min 3.37
+3 hr 09                   3.69
+ 4 hr 30 3.14
+5  hr 49 4.43
 +6 hr 25 4.25
+7 hr 31 4.58
    + 8 hr 3 min  4.89

   At local apparent noon the ice horizon was 2.97' above a fixed point.  1 hour later, 3.37 minutes of arc, and so it should rise without interruption given the clear day.  Not so,  the horizon rose in steps, as often does on clear days, so for hour 4.5  sun rays significantly less hot can't lower the horizon.   Same at hour 5 49 min.   Another possible candidate of heat is the air next to ice loosing heat to the colder ice layer.   But 1 joule of heat loss of air (about 1 C cooling) transposes to top of ice at about +.25 joules.  While 1 cm of sea water at 1 meter square weighs 10 Kg,  that is 3340 kiloJoules per meter square released upwards.   There has to be such diurnal steps. 

WD May 25, June 5-11 2014

Monday, April 28, 2014

Sea ice thermal balance appears to be extremely sensitive to net solar radiation flux

~A small example simply reveals a big mystery.
~ For horizon observations,  sea ice must warm or cool faster than surface air,  this is impossible with a standard physics interpretation.
~There must be an unknown thermal transfer factor which has huge implications with sea ice models.

   Basic refraction optics are easy to understand.  A road mirage exists because there is very hot air above the pavement,  a mere few centimeters above,  where the temperature interface has a very steep unstable adiabatic profile immediately on top of the road.  The much hotter air creates an inferior mirage.   Similar inferior mirages are possible mainly during Arctic fall. A lesser  optical effect with a not so steep but strong adiabatic lapse rate are horizon shifts  which are called dips.  It was observed repeatedly that refraction horizons vary greatly over sea ice,  but these variations are linked with the surface to air interface just as much.  Like the hot pavement,   sea ice is a thermal body,  however much unlike road materials,  sea ice reflects more incoming sunlight without absorbing it.  But the following sequence suggests that sunlight,  even a fraction of it, was very significant,  in fact heated top of sea ice enough to lower the horizon dip significantly before the horizon rose again as with:

     Left to right April 20 2014 evening sequence of sea ice horizon rising within less than 1 hour.  The winds were light (10 knots or less),  the recorded surface temperatures fluctuated less than 0.5 degrees Centigrade.  Yet the sea horizon rose while the sun astronomical elevation dropped from 5.5  to 2.3 degrees.  The only thermal variance is with the sun basically weaker,  injecting less net rays.

     By theory,  sea ice has greater thermal capacity than air, it should not change in temperature at the same time rate as air does.  But this sequence suggests surface of sea ice cooled faster than the air right above.  A colder than air sea ice surface causes thermal inversions,  with horizontal layers readily seen in the left  and center photos.  Atmospheric inversions raise any object in the sky,  including the horizon.

    A same sequence during wide open water Arctic fall time will not repeat the same phenomena,  unless there is ice present.  The relation between not so varying sea surface temperature and the height of the horizon was made clear (paper almost done). There is a direct relation between sea surface and surface air temperature.  The steadier sea surface temperatures revealed a robust repeatable temperature proportionality.

  Current spring sea ice horizon diurnal effect is likeliest due to sea ice deeper frozen core temperature cooling the top of ice more rapidly than the usual swifter double rate of air cooling caused by less sunlight.  Thermal conductivity of  ice is nearly the same as soil, and is several orders of magnitude greater than air.   There may be something else at play,  like an inversion nearer to the camera (disproved very lately),  or a diurnal temperature variation  of near bottom ice sea water column (very unlikely).   This may be why sea ice  models can't replicate great sea ice melts.  The sun and clouds are  linked much more intimately with sea ice thermal exchanges.  This is very well observed.   The famous 2007 Arctic ocean ice melt had a lot of very thick multiyear year ice vanishing under the warm higher in altitude summer sun,  the astounding speed by which very thick ice melted definitely had something to do with the sun and clear air.   It seems that sea ice may be more complicated than simple,  there are known biological interactions,  not so known thermal features associated with structural differences as well.   Here is an example, amongst hundreds, of something worth taking time to achieve a more profound study.  WD April 28, 2014

Theory vs Observations:

       Heat capacity of ice is twice as great as air,  air heat capacity is greater than dry soil.
On a normal mid latitude night,  the air cools slower than dry land,  soil cools faster,
this creates often observed morning inversions.  Eventually likely by direct contact conduction , soil cools surface air.   Not theoretically so for sea ice.   Air should cool faster than ice.  But air cools uniformly,  at any given  time,  given a starting point of sea ice temperature being the same as its surface air (the true astronomical horizon achieved),  the lowering sun should create a warmer sea ice under cooler surface air.  If so, the cooler surface air should be warmed  by the top of sea ice.   If so,  the horizon should drop.   But what is observed is the opposite,  the horizon rises.   The pictures above
strongly suggests colder sea ice than surface air.  Because multiple stacked inversions reveal near surface thermal layers,  of which the top layer is the most distant and last inversion.    If surface air cools faster than sea ice ,  the layer 1 meter above cools at the same rate as the higher ones.  Radiative cooling should be uniform.  It is highly unlikely that the layer of air immediately on top of sea ice cools faster than the immediate air layers above especially if sea ice is warmer.   WD May 4,2014.

Monday, April 21, 2014

Huge near North Pole leads

State of Arctic Sea Ice is answered,  at least near the North Pole,  in the wake of 2 significant Cyclones, multiple leads appeared so early in the season, it looks like a great melt in the making has started especially near the Russian  coast Laptev and East Siberian sea.  

   O degrees meridian North Pole leads look very similar to late May off Ellesmere when "Spring Break" occurs.  WD April21,2014

Sunday, April 20, 2014

Summer early winter 2014 Refraction and by other means Projection

~WHAT is the SCORE?
~Distinct Upper air pattern will shape late spring and summer weather for much of the Northern Hemisphere.
~El-Nino come or come later may not matter.
~Tornado season looks normal or better. Typhoons Galore not Hurricanes

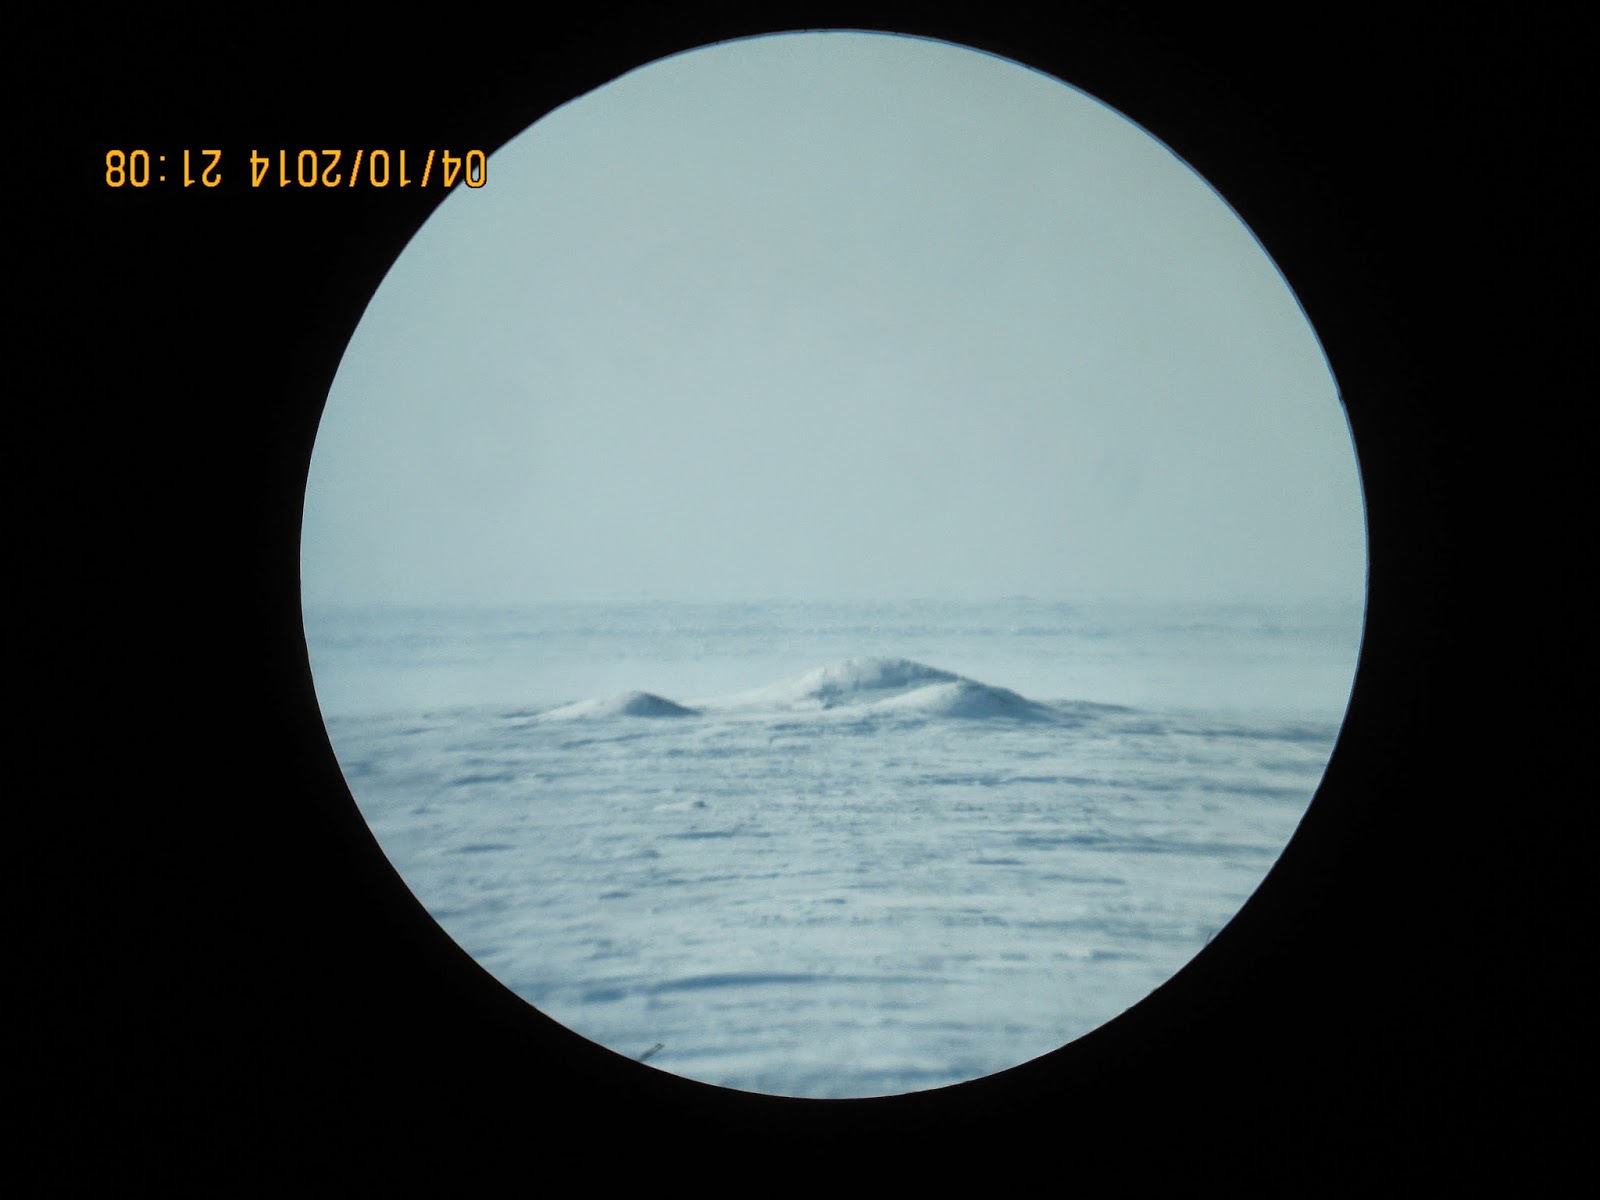
    Here it is ,  the much anticipated (for those who know) howitzer of weather prediction,
the invulnerable replication of the state of the ARCTIC atmosphere when it is suppose to be at its coldest.    Refraction vertical sun disk diameters have the uncanny ability to project Global Temperatures almost always accurately.  Last year's projection #3 warmest is up in the air because NOAA and NASA contradicted each other on the actual result.

   Looking ahead: March 2014 was the warmest in history for the Northern Hemisphere so says NASA:


   But the Arctic was warmest especially Siberia:

       
   While you may be having breakfast in New England,  or by the Great Lakes,  and swear its never been colder.  The rest of the world literally baked.   Note: the coldest spot on the Planet was at times not in the Arctic but over Sub-Arctic Quebec.  

      Many Vertical  Sun disk measurements were taken during this period.  All revealed a duality,  it was very cold near the surface and very warm in the higher atmosphere. In fact,  there was  1 level out of 70 of sun disk measurement average which was found to be greatly expanded, that is from -1.0  to +6.0 degrees astronomical elevation,  as opposed to 11 all time maxima expansions out of 40 levels from 7.0 to 10.9 degrees.

     This means that the Coldest atmospheric zone is largely surface based,  not influenced by a much colder Stratosphere.  This implies a weaker North American tornado season,  in the one part because the ground air is colder,  in the other the much required colder stratosphere is absent:


NOAA   Upper Air Data is largely confirmed by the incredible lack of expanded vertical sun disks below 7 degrees of elevation during March and April 2014.

          Vertical sun disk dimensions expand with a warmer atmosphere and contract with a colder one.  Even more so near the surface when inversions are steeper and more prominent when the surface ground or ice is colder.  

 What is the score?  From 390 refraction observation comparisons with previous seasons 2002-2013:

       #1     2005                     13.64%   
       #2      2014-2013-2010   12.73%
       #3      2011                      11.82% 
       #4      2012-2009             10.91% 
       #5      2006                       10% all time maximas    

   of 110 decimal elevation degree levels2005 had the most expanded sun disk levels followed closely by 2014-2013 and 2010.  The warmest sun disk expansions in Arctic recent history (from 2002 to 2014)  all occurred during the last 5 years at 61%, compared to the previous 8 years.    If the whole Northern Hemisphere temperature remained average from year to year the yearly mean would be about 7.7%.

  NH Temperature Projection for 2014:  2nd warmest year in history without El-Nino,  #1 warmest with a new El-Nino mid-summer onwards.  


 Where will be this Summer's Cold Temperature North Pole?   
       The  C.T.N.P.  zone is actually the biggest single contributor of weather throughout the Northern Hemisphere, it is the heart of the Polar Vortex.   There is CTSP in the Southern Hemishere which does likewise.  As in March 2014 the CTNP was hanging a lot about mid central Quebec,  and gave all kinds of "normal winter of old" weather.  For the folks in NW Europe a summer CTNP at about  Spitsbergen gives buckets of rain especially over the British Isles.     But it seems likely the CTNP to hang about Northern Ellesmere and Greenland, because greater sea ice thickness over Arctic Ocean Basin has been and will continue to help spawn High Pressure systems there.  CTNP over Northern Ellesmere should mainly position the jet stream to the Northwards between Iceland and Ireland.   Although it looks like the rain will return to UK like the summer of 2012,  perhaps less than but certainly plenty grey and wet.  For the shivering Northeastern Americans,  a nice very hot summer awaits,  drier after a wet cool spring.    But it is actually the position of the CTNP which will decide where the jet stream will meander.  An Arctic Dipole will melt the sea ice greater than 2012, the North Pole will see open water,  again like in 2013 when the North Pole was actually a zone of  very loose pack ice,    but this time the sea ice will compress or compact,  leaving a wide open water view of a Pole area not exposed to open water for millennia.


Et Tu ENSO?

     Last year saw the most violent typhoon in history,  Haiyan.   Last year also had no El-Nino as well as no Hurricane season to speak of,  but there was a split personality syndrome;  El-Nino to the North , La-Nina South of equator,  this continues today:

      NOAA/NESDIS  April 17 2014 ENSO suffers again a split personality similar to last year:

Except there is a difference,  the Polar Vortex has shown a dissimilar circulation pattern to last year,  so expect a different result.  The PDO especially from the North Pacific warming is 1.6 points higher.   ENSO variations triggers weather but weather patterns affect ENSO moods.

    April 19, 2014 Polar Tropopause clouds,  higher than Cirrus some appear white some dark,   these are reflections from horizontally Polarized light,  they are a wild mix of chemical clouds, ice crystals and cloud condensation nuclei.  If they exist higher in the sky during twilight the more likely El_Nino is happening.  Right now, at about 7 degrees above the horizon they exist more from a very warm North Pacific and Atlantic,  during an El-Nino they can cover the horizon sky for more than 40 degrees elevation.

     Already in the cards,  more typhoons,  less hurricanes than normal.   If ENSO turns to be a completely formed El-Nino,   the coming winter will be much warmer grey and wetter (yes lots of rain and snow),  if the spilt personality continues (unlikely),   a winter much like the one just past will revisit but with  different CTNP persistent position,.  WDApril 20-21, 2014.

Friday, April 11, 2014

2014 NW passage consistent Sea Ice underside melt more than 3 weeks late


~Sea ice in NW passage thickest in years
~Reasons contradictory but consistent


  April 10 2014 ,  NWP sea ice horizon altitude was same as when surface temperature was equal to open sea surface temperature.  Top of sea ice was at equal temperature than the air right above,  this happens when sun rays combine with heat from underside sea water.  The ice underside melts while the horizon drops no more in altitude, this lasts  until sun beams become lower in the sky.  After that,   the horizon rises dramatically continuously till the next day usually past local apparent noon when the sea ice horizon starts going down in altitude all over again.    On April 14 actual underside melting was short lived,  an hour or so, the over all day had a strong net increase of ice thickness though.  When the horizon altitude appears at melting point for more than 12 hours,  the sea ice thickness starts to shrink from the underside.

    Last 4 preceding seasons,  the melting consistently started 3 weeks prior April 10


Super warm 2010,   sea ice was much thinner,  and had open water leads during all ice months.


     2011 was equally warm and first melt started consistently 30 days earlier than 2014.


   2012,  the year of all kinds of sea ice records,  again the
sea ice started to melt 29 days earlier than 2014.   Ice thickness was similar to 2011.


  2013 ,  the winter of clouds continued into spring, at least on the Canadian side of the Pole.  Ice thickness was similar to 2011-2012.   Clouds enhance melting especially at night,  the combination,  sun at noon clouds at midnight enhance the thawing process.


   March 17, 2014 gave a completely different perspective.  The sea ice is thicker, the sea water under it is likely colder since summer and fall sea water temperatures never warmed appreciably due to continuous cyclone clouds and the scattered nature of the ice pack which never compacted over the Arctic Ocean.

      2014 stands out very strange after more regular successive years,  but it is explainable.   Although the winter was warm for most of the Arctic Ocean,  the North American sub-Arctic was brutally cold.   This affected the Arctic Archipelago area to a great degree.  But we must go back to summer 2013 Arctic Cyclones pervasive presence which stopped the warming of the Arctic Ocean as with preceding recent years,  this allowed spreading out of loose pack ice to trigger earlier onset of fast sea ice in the fall.   The greater Pan-Arctic winter was mostly cloudier,  but without a great deal of precipitation in the CAA Arctic Basin area,  this made the sea ice even thicker during wind storms.  After end of long night, a short lived La-Nina partially triggered a cloud free period made even less cloudy by the thicker Archipelago sea ice area spurring the creation of consistent Anticyclones.  We are at this time experiencing the continuance of Anticyclones which favor ice accretion until the sun becomes too high in altitude.  There is evidence that the CAA will continue being pervasively anticyclonic until summer.  wd April 10-11, 2014

Saturday, March 15, 2014

Sun line announces the return of persistent Arctic Anticyclone genesis

~ Spring 2013 had a remarquable period of persistent Cyclonic activity caused by adiabatic surface to air profiles.

~ 2014 already looks quite different

    Considerable effort drove me to determine the reason why Arctic 2013 was so much adiabatic in nature.  The very reason why Cyclones were extremely prevalent especially
from the spring onwards,  ultimately leading up to affect the sea ice minima,  by severely reducing sea ice compaction,  in effect stunting a sure to be greater melt than 2012.  Adiabatic air welcomes cyclonic invasions,  while stable much colder surface air acts as a barrier,  a wall against cyclonic penetrations.

    As you may read my spring based 2013 projection as seen on top of www.eh2r.com ,
the cyclonic activity to come was observed quite entrenched by affecting refraction effects.  Adiabatic surface to air interface dominated spring 2013 so strongly that I was certain and had no doubt that this feature will continue.  However,  early 2014 refraction optics show great evidence of the resumption of more normal Arctic Archipelago weather,  having a greater balance between adiabatic and stable upper air profiles.  In no
small part due to thicker sea ice between the channels caused by summer 2013 not having a great deal of sun ray heating of the sea by the everlasting presence of clouds
which permeated the entire 24 hour sun light season

     Triple Green flashes (seen red because of the filter) on top the much flattened setting sun of March 15 2014.    Clear signals by the heavily stratified nature of the lower atmosphere,  a sign that sun rays traversed an anticyclone.


    Same day right after not so famous but awesome sun line,  not seen like this so bright and strong for years.  
   The sun here is seen entirely compressed about 30 times.  Looking like"fire on the ice".
The sunset ended -2.23 degrees below the astronomical horizon.  Below -2 degrees sunsets were quite rare over the past 8 years.  The thicker sea ice of the Northwest passage cooled faster after a day of sunlight hitting it,  this created many isothermal layers right above,  since air didn't cool as rapidly,  ideal conditions existed for refraction ducting.  

     The basic difference between 2014 and 2013 is a presently colder Archipelago influenced by a a very frozen continent to the South,  in part created by strong albedo action from last summer overwhelming presence of clouds associated with persistent numerous cyclonic incursions.   This long streak of cyclonic activity is currently loosing steam because the local sea ice in a large area is healthier thickness wise,  at least around the archipelago, which is  a much colder area than the rest of the present day Arctic which has had a very warm winter.  The resultant after effect of newish anticyclone genesis should eventually  trigger the return of  more sun rays reaching the the most frozen side of the Arctic.  But since there is a temperature dipole in place, the rest of the Arctic Cyclones should continue enveloping the anticyclonic colder zone.  The very existence of stable air at the surface over the cold area will move about its source,  in effect creating more compaction,  and surely a lesser sea ice minima than last year.  WD March 15, 2014


Thursday, March 6, 2014

Warming in the Arctic blasting cold waves Southwards?

~ Apparently the Arctic can do 2 things,  either it has a deeply frozen atmosphere  spreading outwards or be warmer at once.
600 mb temperatures closely represents the temperature of the entire troposphere.  Courtesy NOAA.  February 1982 (left)  Arctic Atmosphere was extremely cold almost covering the entire Arctic
while February 2014 (right) was substantially warmer,  with a much weakened Arctic Ocean winter.   Lame ,  more than twice smaller.  


How can most presenters claim Arctic blasts  lowering the temperatures enough in Eastern Mid North America to almost freeze the Great Lakes completely,  when a really cold historical Arctic had less an effect on the same lakes?   The answer is spatial compression and also a greater potential of heat radiation to space over the continents primarily because the continents cooled more readily as they are physically unchanged, opposed to a cloudy Arctic bombarded with Cyclonic intrusions having changed Sea ice wise.   


The latest North American "Arctic blast"  was influenced by a very small Archipelago cold air vortex,  the Cold Temperature North Pole (in blue),   which grew significantly in size and cooled further over Sub Arctic!  It was  not quite an Arctic blast.  NOAA's satellite 
missed some extent of the boreal forest area cooling in Mid-Quebec,  radiosonde measurements there were in excess of -43 C at 600 mb.  But the rest of the Arctic ocean 600 mb temperatures were more than 20 C warmer.  

The also common saying "the Arctic Cold air" was replaced by advection from the South, "pushed away" by advection.   Not quite so.   Over the Archipelago,  where the coldest air was during Feb 23-26,  the air warmed from a trough of warm air extending itself from a Baffin Bay Low pressure along with and incursion of warmer air from the North!  Originating from the North Atlantic no less. The Archipelago atmosphere primarily warmed literally from above both ways,  from Latitude and altitude.   The correct interpretation of the latest "blast":  the remnant of coldest winter formed greater over the Boreal zone,  it was a Boreal blast!  WD March 6, 2014    

Monday, February 17, 2014

The Polar Jet streams further North


   Let us take 2 known climate records from history,  the very cold winter of 1981-82,  cold either in Europe or North America,  and the very strange winter of 2013-14, cold in some places and warm in some others.  On NOAA climate composite chart on top we can see jet stream largely Southwards compared to January 2014 being largely more jagged  and more to the North.


         Reason for 2014 extreme North Pacific location may have something to  do with North Pacific temperature anomaly and extremely much warmer Arctic Ocean air temperatures.  On a whole the Polar Jet Stream must and did move Northwards as it is overall warmer in 2014 compared to January 1982.  This 2014 pattern gave the strange weather like California drought,  weird cold winter storms in SE US,  massive storms from one strong Cyclone after another hitting and flooding the British Isles and Ireland,   a warmer Olympics even if it is in Sochi.  Finally a much warmer Arctic warmed by the same Cyclones hitting the Isles, and also from Cyclones coming from the North Pacific.  Warmer over all weather means the Jet streams moved North and meandered more steeply, causing unusual patterns creating havoc instead of more predictable weather.  WD February 17 2014...

Friday, February 14, 2014

Great sea ice melt mechanics

~2013 minima results needs be explained
~2014 melt gearing up to be big


Continuous warm anomalies over the Arctic Ocean have been as incredible as the lack of sea ice compaction last summer.  Both result from the same polar vortex wave arrangements, almost  unrelenting like UK storms which flood the Isles and head towards the Pole.  So I am truly not surprised about current low sea ice extent, it was suggested at the time of last minima by the very same cloudy cyclonic coverage which made the minima bigger.  Again the big question is whether sea ice compaction will return come this summer,  if it does,  I can easily foresee a greater melt than 2012.  That is the big if.  Something must ward off these cyclones from hitting the High North so often, particularly the pack ice center.  This something may be El-Nino or more likely a low sea ice extent area of relatively thick ice in the spring. Once the Polar shores are free of ice, a confluence of regularly positioned cyclones may return the Basin Gyre clockwise.  One over Barents and North Pole, the  regular expansive Baffin Bay Cyclone and lastly  over East Siberian Sea.  These 3 will generate an anticyclone covering the remaining Pack ice.  

        Arctic Ocean  shorelines with open water create anchors or stabilizes Cyclones to remain on top of water.   A near persistent Low centering the Arctic Basin, same as last summer, may bring a cold spring .  Ice clogged shoreline areas favor Highs instead of Low pressure cyclones fueled by water.   An earlier than expected shoreline "spring break" of the entire Arctic Ocean sea ice area may change polar patterns though.  Weather patterns rarely remain the same forever,  when they appear to do so,  they set up the new weather system arrangements to come.  


  Search for "Spring Break"  2013;   


      "Spring break" is seen when the entire Arctic Ocean pack gyrates almost uniformly, when it appears to be free from its connection to land,  the best way to see it is with satellite picture animations,  single high resolution satellite pictures do not reveal this event well:

   2007 sea ice looked better than 2013 on the same May date.  But the end result  at minima was different.  


     Although by May 14 2007,  the entire sea ice broke free from shores and rotated clockwise for the first time:

      Using available animation, when the big lead off the Canadian Archipelago coast spanned all the way to the Atlantic,  the entire ice pack was seen rotating on May 14 2007.   It was the beginning of one massive melt of even very thick ice.  


    2013 had a different look, plagued by steady Low pressure cyclones over the Arctic Basin, which killed the usual compaction favoring clockwise movement of sea ice.   By August 2013 the melt was strong but stayed in place, favoring 
a wider over all extent of loose pack ice.     But by mid May 2013 there was no apparent "Spring Break"  until August with available video   from NASA.

   The entire Arctic Ocean ice didn't appear to turn clockwise at all,  it was an anti-compaction melt season.

      There were those who believed 2013 was a "recovery"  from previous torrid melts.  But these suggestions were ignorant about the holistic nature of sea ice.  It was not a recovery at all, but another great melt which didn't move normally. A continuous repeat of the same weather pattern causing this unusual lack of movement is highly unlikely.  But even if it does,  the sea ice will melt just as much but apparently more slowly year by year.  But I'd expect the return of the Arctic basin Gyre because the clouds have created a lower extent of thicker ice, this will allow an earlier spring break. WD Feb14,2014